It is a widely accepted fact that state-sponsored Twitter accounts operated during the 2016 US presidential election, spreading millions of tweets with misinformation and inflammatory political content. Whether these social media campaigns of the so–called “troll” accounts were able to manipulate public opinion is still in question. In this post we discuss the findings of our recent study in which we quantified the influence of state-sponsored trolls on Twitter during the 2016 US presidential election [1].
State-sponsored disinformation activities on Twitter
The Russian efforts to manipulate the outcome of the 2016 US presidential election were unprecedented in terms of the size and scope of the operation. Millions of posts across multiple social media platforms gave rise to hundreds of millions of impressions targeting specific segments of the population in an effort to mobilize, suppress, or shift votes [2]. Trolls were particularly focused on the promotion of identity narratives, though that does not distinguish them from many other actors during the election. The Special Counsel’s report described this interference as “sweeping and systematic” [3]. Russia demonstrated an impressive array of tactics to inflict significant damage to the integrity of the communication spaces where Americans became informed and discussed their political choices during the election [4].
Quantifying Users’ Influence
There is considerable debate as to whether state-sponsored disinformation campaigns that operated on social media were able to affect the outcome of the 2016 US Presidential election. Although there is a large body of work that tried to address this question, a conclusive result is still missing. There are several obstacles that every empirical study on this subject has dealt with: (i) the lack of complete and unbiased Twitter data – the Twitter API returns only a small sample of the users’ daily activity; (ii) Tweets from deactivated profiles are not available; (iii) The followers and followees lists are not always accessible, hence the social graph is unknown.
In [1], we measure the impact of troll activities on the virality of the ambiguous political information that had been shared on Twitter during the 2016 US Presidential election. First, a large sample of the overall activity in Twitter was downloaded during the period of 2016 US presidential election (from September 21 to November 7, 2016), using the Twitter API and was based on a set of track terms related to political content. Hence, we have access to original troll tweets from that period. Based on ground–truth data released by Twitter itself [5], related to state–sponsored accounts linked to Russia, Iran, Venezuela and Bangladesh states, we identify 822 trolls present in our data. Then, we construct a very large directed graph from the interactions (tweet replies, and mentions) between the users which serve as an approximation of the original followers–followees social graph. The graph consists of 9.3 million nodes/users and 169 million edges.
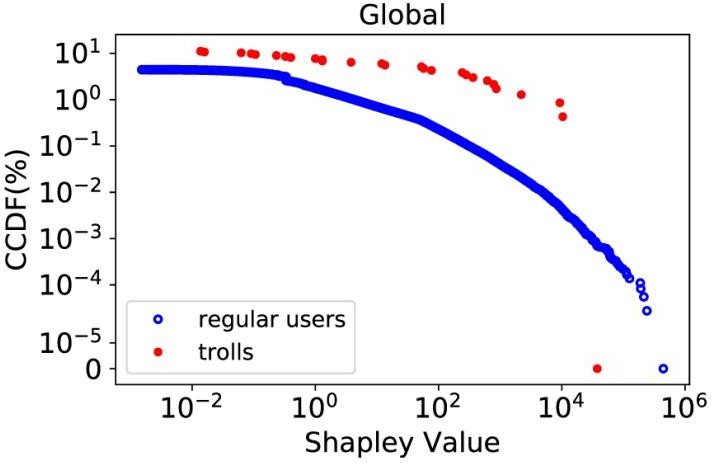
We measure the users’ impact on the diffusion of potentially political content as is represented by the retweet cascades of tweets that contained at least one Web or media URL. The URLs indicate that the information contained in the tweets which started the cascades was potentially related with the political race that took place during that period. We introduce the notion of flow graph – a natural representation of the information diffusion that takes place in Twitter platform during the retweet process. This formulation allows us to apply a game–theoretic centrality measure for a fair estimation of users’ contribution on the information shared, without requiring assumptions on the user behavior. We apply the Shapley Value–based degree centrality introduced by Michalak et al. [6] which is based on the Shapley Value (introduced by Lloyd Shapley in 1951), a division scheme for fair distribution of gains or costs in each player of a cooperative game. Furthermore, we estimate the true retweet paths by constructing the retweet cascade trees where we measure how viral they are by the structural virality [7].
Findings
- The most popular tweets (tweets that have been retweeted thousand times) have been posted by regular users – users who have not been classified as trolls by Twitter.
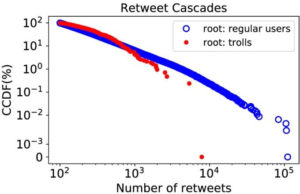
- Although the trolls initiated some viral cascades, their role was not a dominant one and the vast majority of viral cascades were initiated by regular users.
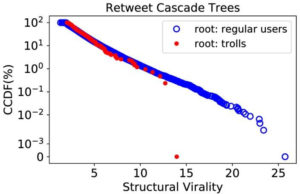
- The regular users had the largest impact/contribution on the diffusion of information (i.e. retweet process).

- We provide a global influence ranking (based on Shapley Value) of all Twitter accounts and we find that one troll account appears in the top–100 and four in the top–1000.
|
Troll accounts in top–1000 |
||
|
Ranking |
Screen–name |
User ID |
|
27 |
TEN_GOP |
4224729994 |
|
150 |
Pamela_Moore13 |
4272870988 |
|
181 |
America_1st_ |
4218156466 |
|
769 |
tpartynews |
3990577513 |
In conclusion, we have found strong evidence that troll activity was not the main cause of virality in Twitter during the 2016 US presidential election. Our measurements show that the regular users (users that have not been classified as trolls by Twitter) were in general the most active and influential part of the population and their activity was the driving force of the viral cascades. On the other hand, we found that the average influence of trolls was tens of times more than the influence of the regular users. This indicates that, the strategies these trolls followed in order to attract and engage regular users were sufficiently effective. Furthermore, 23% and 22% of regular accounts in the top–100 and top–1000 respectively, have now been suspended by Twitter. This raises questions about the authenticity and practices of these accounts during that period.
(By Nikos Salamanos, Cyprus University of Technology)
References:
- Nikos Salamanos, Michael J. Jensen, Xinlei He, Yang Chen, Costas Iordanou, Michael Sirivianos. 2020. “Did State-sponsored Trolls Shape the US Presidential Election Discourse? Quantifying Influence on Twitter”. https://arxiv.org/abs/2006.09938
- Kathleen Hall Jamieson. 2018. Cyberwar: How Russian Hackers and Trolls Helped Elect a President What We Don’t, Can’t, and Do Know. Oxford University Press.
- Robert S. Mueller. 2019. Report on the Investigation into Russian Interference in the 2016 Presidential Election. Washington, DC: Department of Justice. Available at https://www.justice.gov/storage/report.pdf.
- Michael Mazarr, Abigail Casey, Alyssa Demus, Scott Harold, Luke Matthews, Nathan Beauchamp-Mustafaga, and James Sladden. 2019. Hostile Social Manipulation: Present Realities and Emerging Trends. Santa Monica: Rand Corporation. Available at https://www.rand.org/pubs/research_reports/RR2713.html.
- https://about.twitter.com/en_us/values/elections-integrity.html
- Tomasz Michalak, Karthik Aadithya, Piotr Szczepański, Balaraman Ravindran, and Nicholas Jennings. 2014. Efficient Computation of the Shapley Value for Game-Theoretic Network Centrality. Journal of Artificial Intelligence Research 46 (02 2014).
- Sharad Goel, Ashton Anderson, Jake Hofman, and Duncan J. Watts. 2015. The structural virality of online diffusion. Management Science 62, 1 (2015).